
by Robert Vanderbei, Assistant Director assist.director@princetonastronomy.org
My Seestar S30 Pro smart telescope has two different imaging options. There is the default which is used to take photographs of small things like nebulas, galaxies, and our planets. The other option uses a different lens that provides a much wider field of view so that we can take pictures of our Milky Way galaxy. In this mode, the angular field of view is 32 degrees by 57 degrees. A few days ago, I used the Milky Way mode to take pictures of… you guessed it… the Milky Way. The best picture I got is a stack of sixty 10-second exposures automatically taken and combined by the Seestar app.
Here’s the picture…
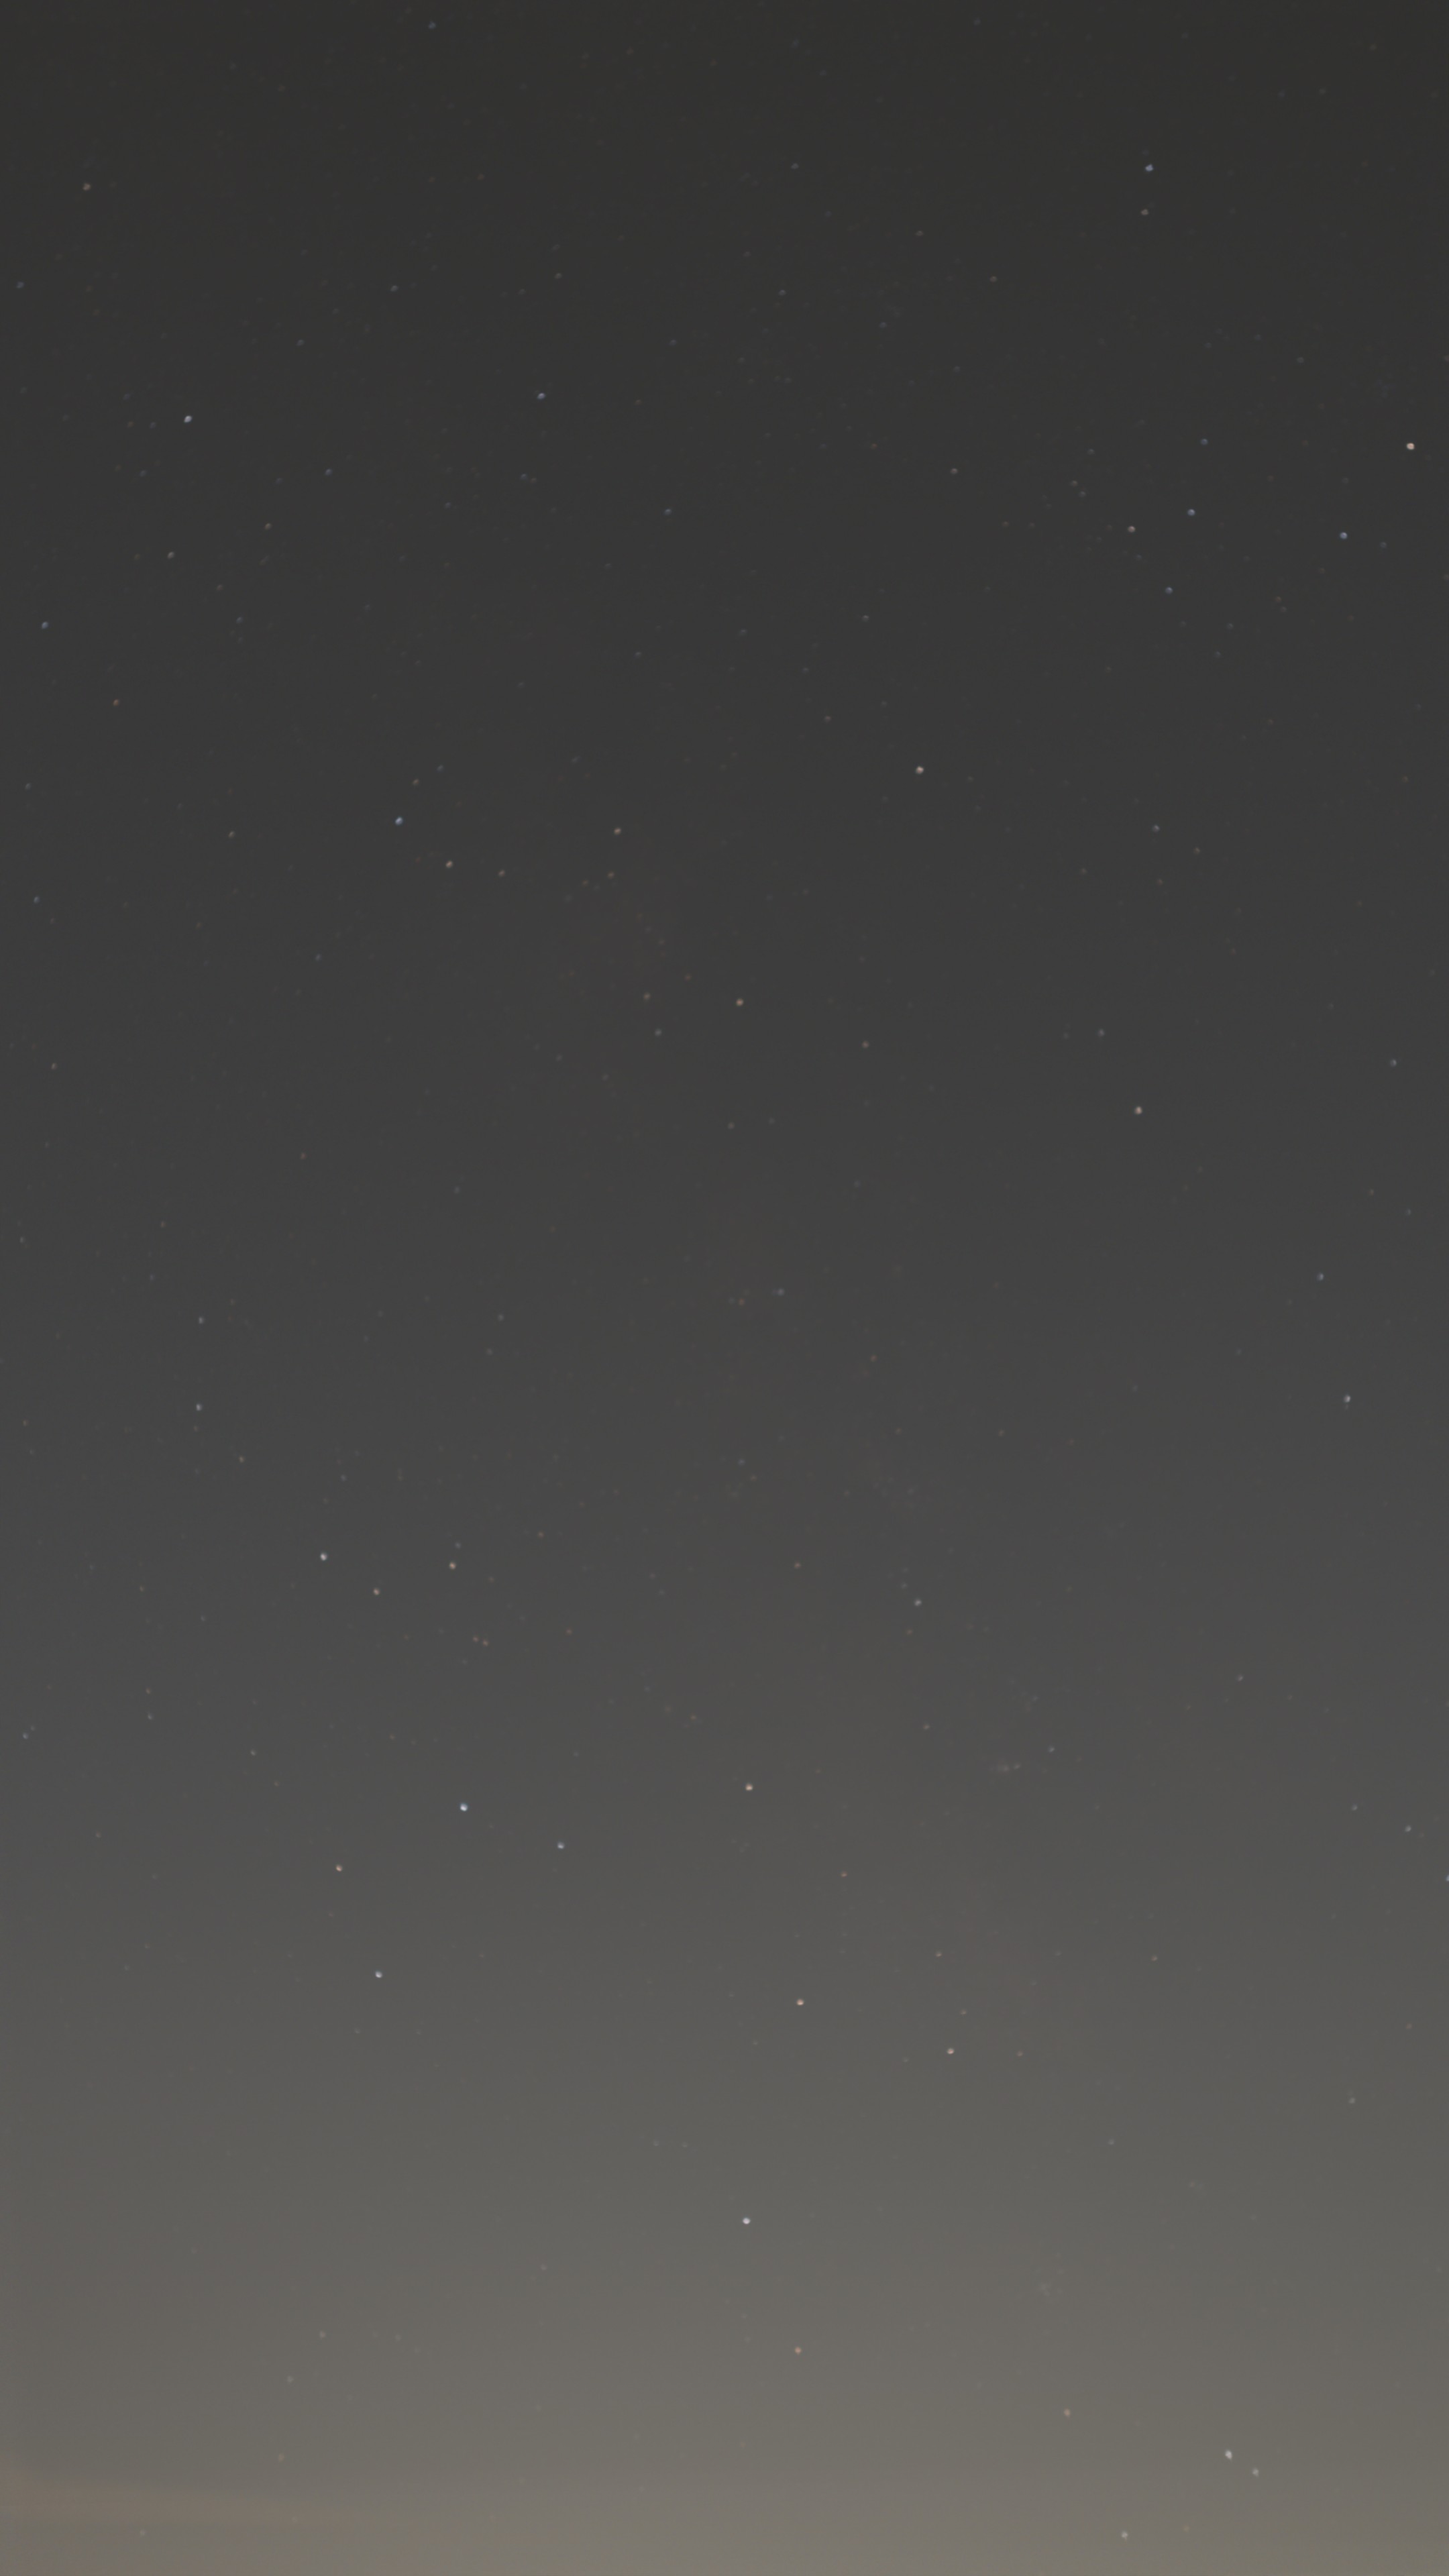
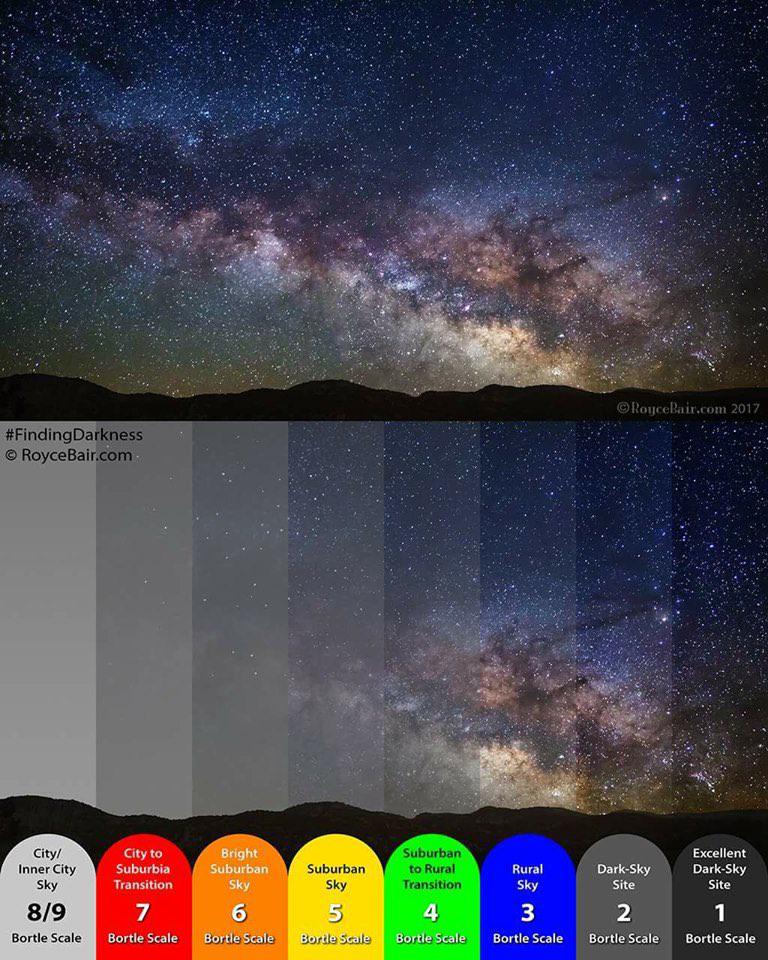
Oh, you don’t see the Milky Way? It is there. But, it’s completely dominated by the light pollution here in NJ. I took this picture at the Montgomery Veterans Park, which is only about a mile from where I live here in Montgomery NJ. I went there because I wanted a good view down close to the horizon. But, even at the park light pollution is a significant issue. Also, the Moon was up. It was in its first quarter phase so it wasn’t terribly bright and it was about 60 degrees away from where I was imaging the Milky Way. So, I don’t think the Moon was a big contributor to the light pollution. I was pointing my Seestar south so light from Princeton NJ and even Philladelphia PA was the major contributor. For those of you who are familiar with the Bortle light-pollution scale, this picture was taken in Bortle 6 sky.
Anyway, if you look at the picture you can see some stars. Down by the bottom of the picture you can see the bright stars of the Sagittarius constellation. These bright stars are often referred to as the Teapot Asterism because they look like a drawing of a teapot.
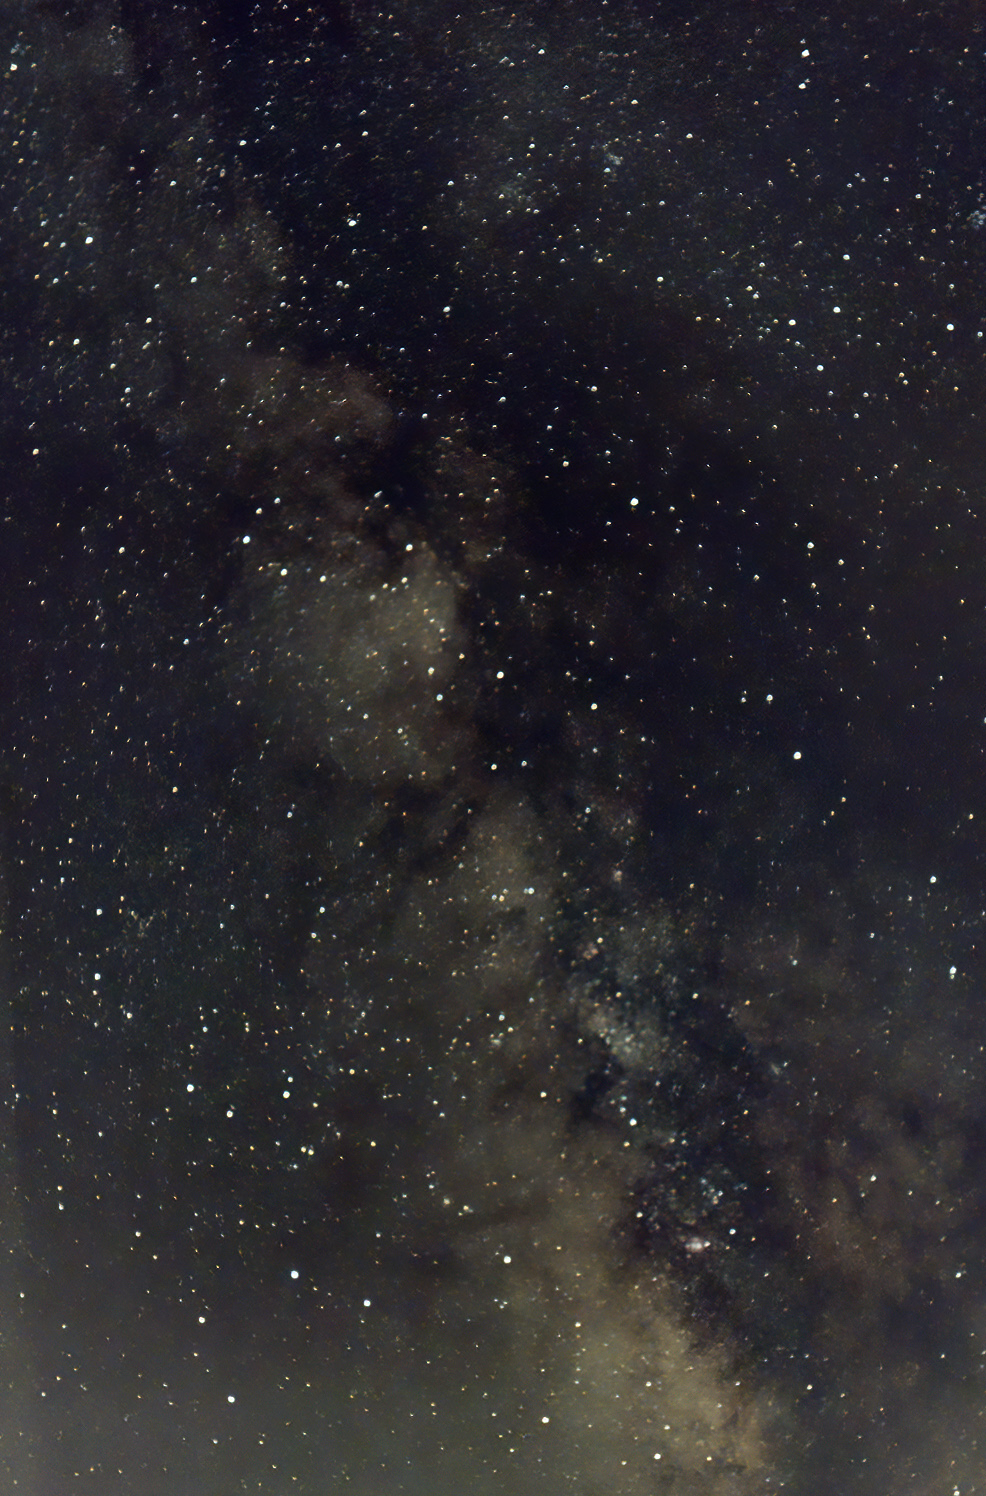
So, in my hope to get a picture of the Milky Way, this looks like a total failure. But, here’s the interesting thing. In addition to the 8-bit jpg file shown above, the Seestar app also saves a so-called “fits” file that has data at the 16-bit level. So, with a jpg file each pixels red, green, and blue levels vary from 0 (no light) to 255 (fully illuminated). With the fits file, the numbers range from 0 to 65535. That’s a lot more informative. So, with ChatGPT’s help, I wrote some python code to estimate how bright the light pollution was at each pixel and then subtract out the light pollution. I then used the PixInsight app’s Screen Transfer Function to adjust the brightness.
Here’s the result…
Bortle Scale Maps of the World


